Single-cell RNA sequencing (scRNA-seq) is one of the most rapidly advancing and diversifying technologies in molecular biology. The ability to study gene expression on the resolution of single cells has been as transformative as the advent of bulk RNA-sequencing previously.
In addition to single-cell RNA-seq, a number of other next-generation sequencing (NGS) -based assays have been adapted to single-cell protocols. These include genomic, proteomic and epigenetic assays, notably single-cell ATAC-sequencing, which is commonly performed in conjunction with scRNA-seq.
Platforms and protocols for scRNA-seq vary in their throughput (number of cells) and transcript coverage (3'/5' tag-based vs whole-transcript). Our team has experience working with several technologies, such as 10X Genomics, Drop-Seq, BD Rhapsody system and protocols of the CEL-Seq and Smart-Seq families.
Here we present typical single-cell analyses, focusing on scRNA-seq but covering also its integration with other common single-cell assays. We also list single-cell papers that we have published.
Quality control and preprocessing
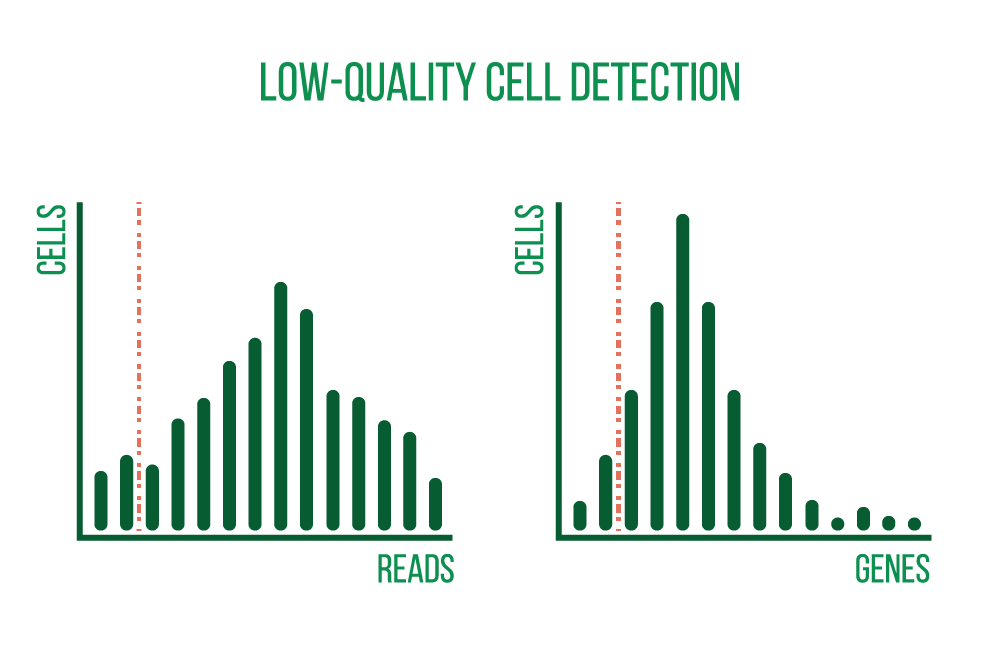
The analysis of single-cell sequencing data starts with quality control and preprocessing. Quality-checking is performed on raw sequencing reads, and metrics such as cell quality, accuracy, and diversity are generated. Reads are then aligned against an appropriate reference genome or transcriptome, also plotted and examined are various metrics including the number of cells, reads per cell, genes per cell, sequencing saturation, and the percentage of mitochondrial transcripts.
These QC measures allow us to recognize and exclude low-quality cells and provide information about the overall quality of the libraries and the usability of the samples.
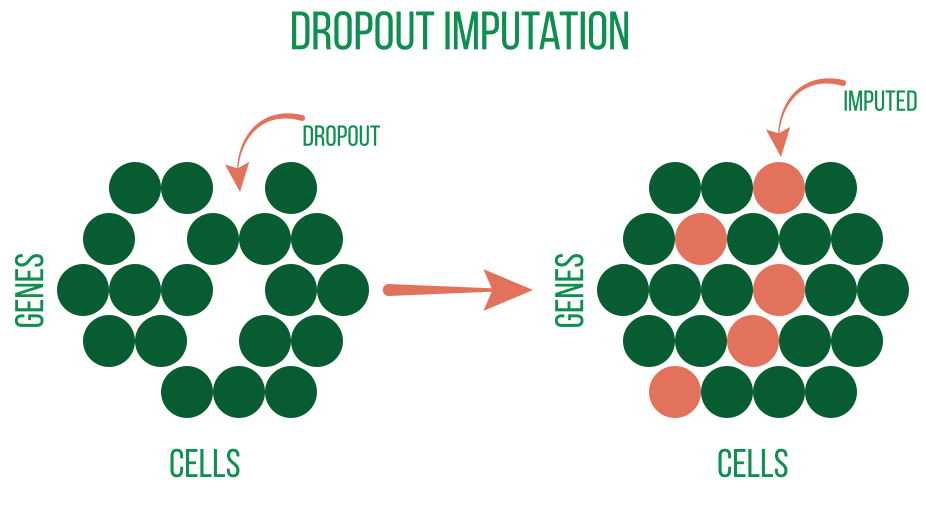
In order to remove undesirable signal or noise from some downstream analysis, further preprocessing is frequently applied. These consist of:
Exploratory analysis
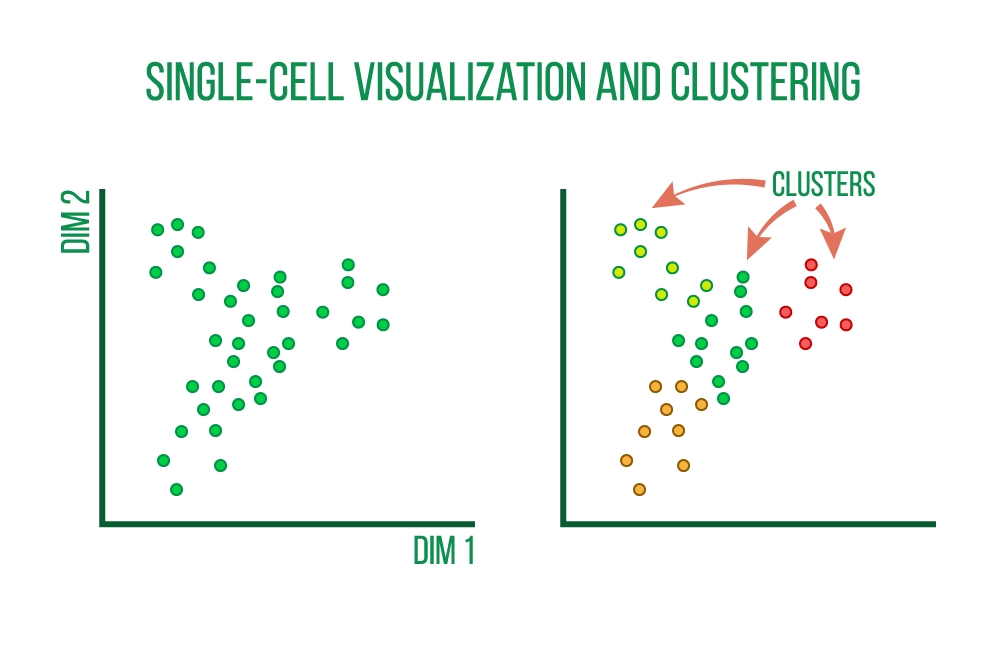
In order to uncover broad patterns of cell heterogeneity, preprocessed single-cell RNA-seq data is clustered to identify collections of cells that are similar to one another and then displayed using non-linear dimensionality reduction algorithms like tSNE and UMAP and correlation heatmaps.
We may resolve complex issues with these visualizations, such as:
...as well as biological inquiries like:
Cell type identification
The main focus of the majority of single-cell projects is identifying and characterizing different cell types (and more complex cell states).
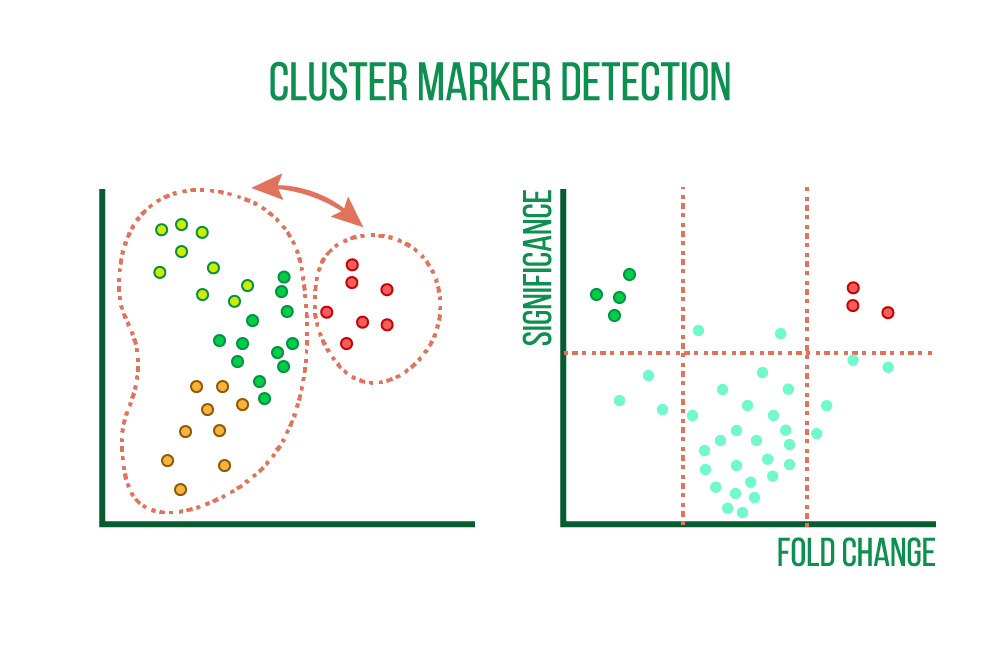
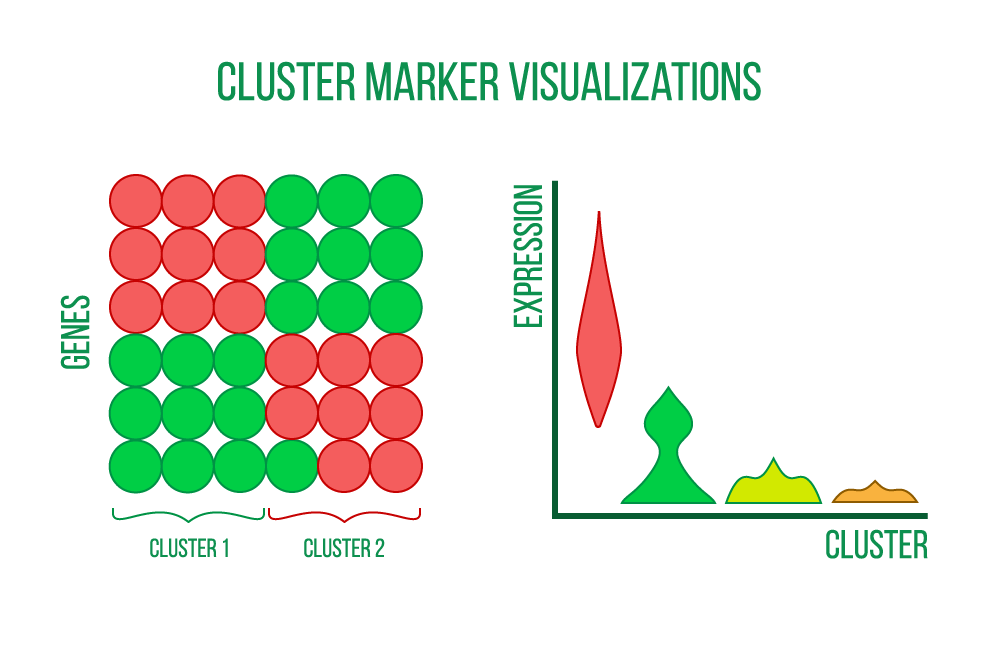
Finding characteristics unique to each cell cluster, such as genes, proteins, and accessible regions, is the first step in the process. These markers are determined by comparing each cell cluster's differential expression (DE) to that of the remaining cell clusters, which results in DE statistics like fold change and statistical significance.
Heatmaps, violin plots, and scatter plots can be used to see the cluster markers.
Additionally, markers are associated with biologically significant terms like biological processes, signaling pathways, or particular diseases. Both over-representation analysis and gene set enrichment analysis produce lists of enriched gene sets with pertinent statistics and annotations, which are the two methods that these analyses may use.
Trajectory analysis
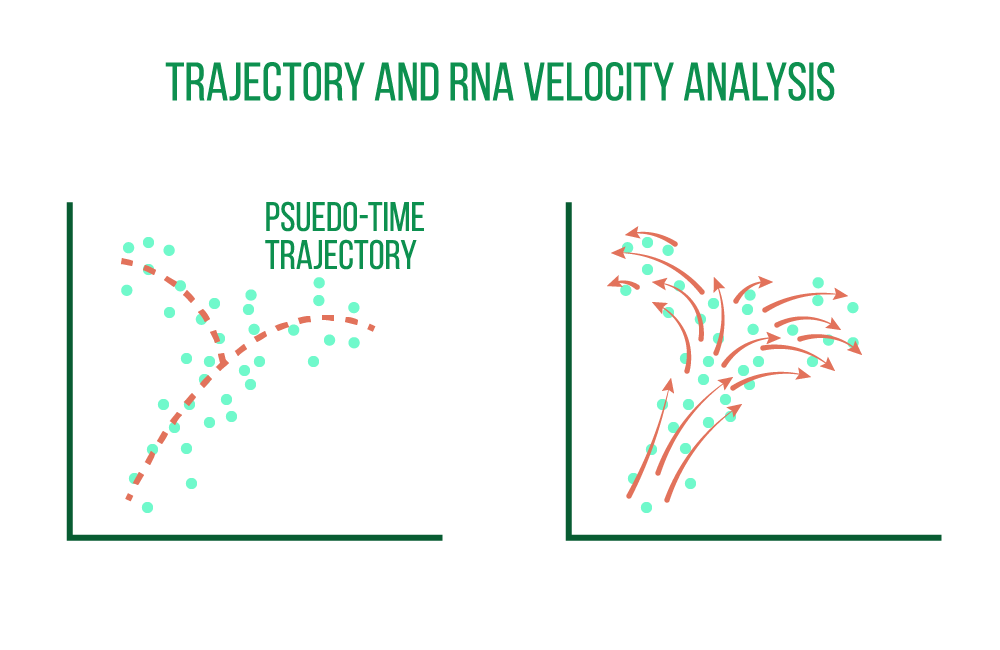
Single-cell data is well suited for tracing trajectories of gradual change in cell state in addition to characterizing distinct cellular identities. While all cells are sampled at the same time point, finding such continuums is also known as pseudotime analysis. Individual cells may represent various stages of a temporal process, such as differentiation.
Exploring cellular dynamics, defining cell developmental lineages, and characterizing the transition between cell states along a latent pseudotime dimension are all made possible by the de novo reconstruction of lineage differentiation and cell maturation trajectories.
For reliable identification of root and terminal cellular states, branching points, and lineages, a group of trajectory inference algorithms may be used. Single cells are ranked in deterministic or probabilistic lineages, and their ranking shows how they have developed in an interesting dynamic process.
The ratio of processed to unprocessed transcripts may also be used in this type of analysis to determine whether a gene's expression is rising or falling in a particular cell. The direction and rate of change in states can be inferred by combining the data from all quantified genes at a particular state. The term for this is RNA velocity analysis.
Integrative single-cell analyses
Integrative single-cell analyses combine a variety of datasets, including various species and data types. This makes it possible to label cells more precisely and in-depthly and to gain mechanistic insight into how the studied system's genes are regulated. Such analyses rely on shared characteristics, or anchors, between the datasets, such as matched cells or features (such as genes or homologues).
Integrating multiple single-cell RNA-seq datasets
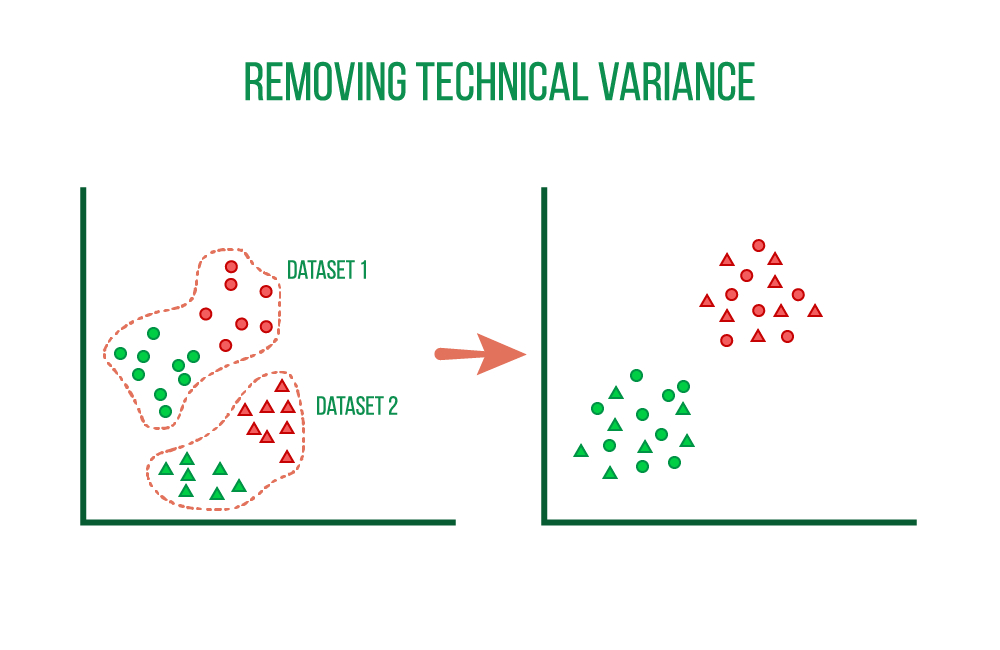
The integration of scRNA-seq datasets from various sources or technological platforms may be the most typical process for single-cell datasets. A successful integration eliminates the technical bias while preserving the biological variance of the datasets using genes as anchors.
The integration of scRNA-seq datasets from various sources or technological platforms may be the most typical process for single-cell datasets. A successful integration eliminates the technical bias while preserving the biological variance of the datasets using genes as anchors.
Integrating single-cell RNA-seq and epigenomics
Matching cells are frequently used as anchors in the integration of single-cell RNA-seq data with single-cell ATAC-seq or single-cell methylation data (when the measurements derive from the same cells as in, e.g., 10X Genomics Multiome technology).
More accurate cell type identification and quantification of the relationship between chromatin state and expression in specific cell types are made possible by combining expression data with chromatin accessibility or methylation profiles.
Integrating single-cell RNA-seq and proteomics
Single-cell proteomics provides more precise estimates of the functional states of cells as a complement to scRNA-seq experiments because proteins, not transcripts, are the primary drivers of cellular functions.
Single-cell proteomic profiling, including CITE-seq, flow cytometry, mass cytometry, and mass spectrometry, can be targeted specifically at surface proteins. For example, CITE-seq involves the quantification of a panel of surface proteins from cells with matched scRNA-seq reads.
Surface proteins are especially helpful in identifying the type of cell, and the addition of cytosolic proteins allows for a better understanding of pathway and gene-regulatory activities.
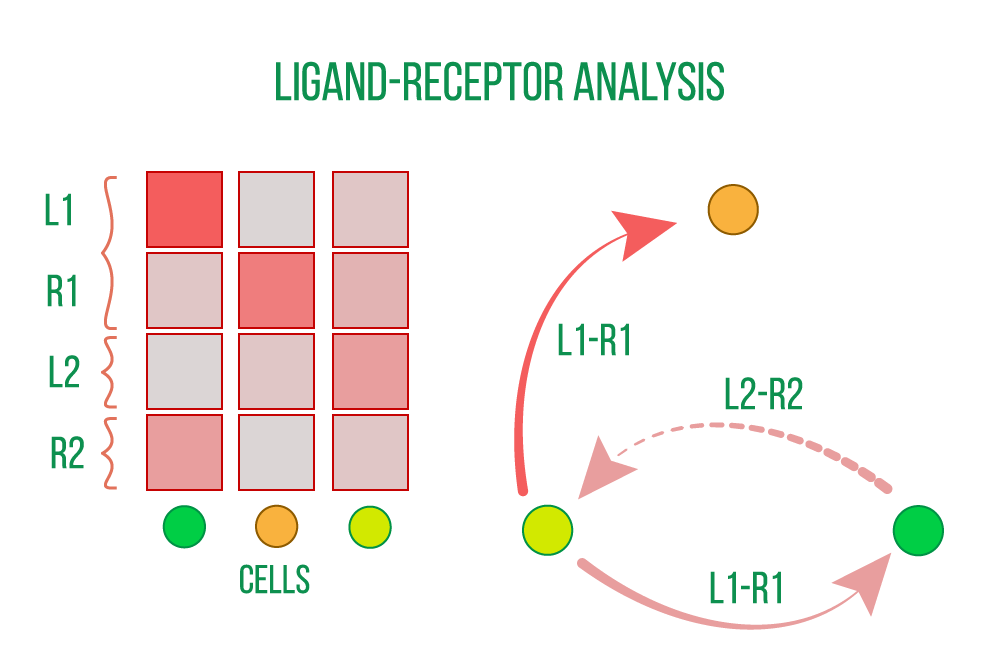
Ligand-receptor analysis
Cell-cell interactions that control homeostasis, development, and other system-level processes are revealed by ligand-receptor (LR) analysis. In an analysis that is only concerned with the internal state of specific cells or cell types, changes and dysfunction in such interactions might go unnoticed.
Analysis of ligand-receptors based on the expression of known receptors and their ligands, identifies and measures intercellular interactions. The strength of this interaction is compared between biological conditions of interest, such as patient groups, disease states, and treatments, and interactions may occur within or between tissues.